Computing photometry and SEDs of galaxies in a diffsky mock
This notebook shows how to compute photometry and high-res SEDs of galaxies in a diffsky mock stored in the opencosmo format.
Note: You must be using
opencosmo 1.3.0or above for this notebook to work correctly.
[1]:
import numpy as np
import healpy as hp
from matplotlib import pyplot as plt
[2]:
from diffsky.data_loaders.opencosmo_utils import load_diffsky_mock

# Change to the directory where your mock is stored
directory = "oc_download_dir"
[3]:
catalog, aux_data = load_diffsky_mock(directory)
/home/docs/checkouts/readthedocs.org/user_builds/diffsky/conda/latest/lib/python3.12/site-packages/diffsky/data_loaders/opencosmo_utils/load.py:62: UserWarning: Version checking is disabled (mode = None in versions.py). Photometry and SED calculations may not work quite right if your versions of the diffsky libraries do not match those used to generate this catalog.
  check_versions(catalog, version_check)
Inspect the mock data
The catalog data is returned as an OpenCosmo dataset. The OpenCosmo toolkit provides extensive tooling for querying and analyzing diffsky data, allowing you to select the specific types of objects you are interested in and prototype analyses on small samples before scaling them up. More details on the toolkit and its capabilities are available in the documentation.
Additionally, the load_diffsky_mock function returns auxilliary data which is used by diffsky to compute photometry or SEDs. The most important thing in this auxilliary data is the transmission curves, which determines which bands you can compute photometry for.
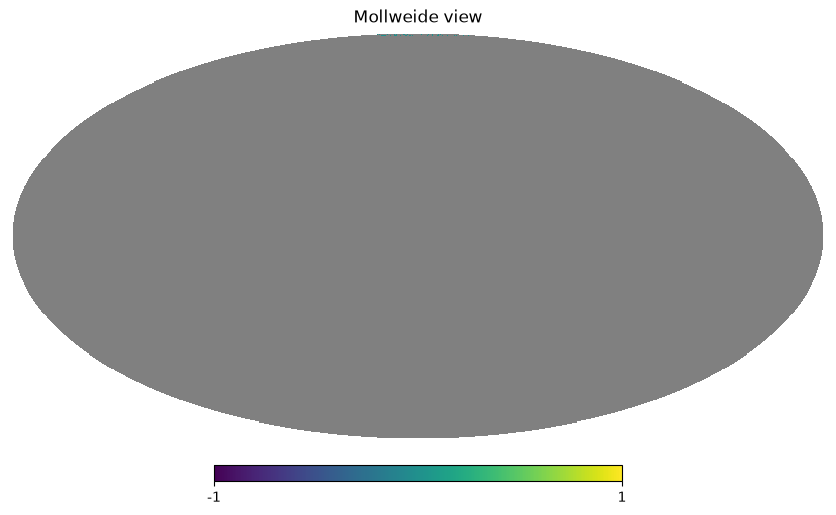
We can quickly determine the sky area of the mock with a few simple function calls
[4]:
nside = 1024
pixels = catalog.get_pixels(nside)
pixel_area = hp.nside2pixarea(nside, degrees=True)
print(f"Total sky area is {len(pixels) * pixel_area:.2f} degrees")
Total sky area is 6.64 degrees
We can also plot a map of the sky coverage, though we note the coverage of this example mock is small compared to the whole sky.
[5]:
from healpy.visufunc import mollview

npixels = hp.nside2npix(nside)
coverage = np.full(npixels, hp.UNSEEN)
coverage[pixels] = 0
mollview(coverage, nest=True)
plt.show()
The full catalog contains millions of objects. We will select a much smaller subset for the purposes of this demo.
[6]:
catalog = catalog.with_redshift_range(0.0, 0.1).take(300)
Note: The SEDs of diffsky galaxies include an ex-situ contribution from galaxy merging. Thus correctly computing the photometry and SEDs requires information about the central galaxy and all of its satellites. opencosmo automatically keeps cen-sat systems together to ensure photometry can be calculated. As a result, the actual catalog produced by the line above will contain more than 300 objects
Recompute mock photometry
You can use the compute_phot_from_diffsky_mock function to compute mock photometry for any of the available bands. The cells below will use this function to compute photometry for the "lsst_i" and "lsst_u" bands, and insert them into the catalog as "lsst_i_new" and "lsst_u_new" (to avoid clashing with the exisiting "lsst_i" and "lsst_u" columns). We then check that the computed photometry is consistent with the original photometry present in the catalog.
[7]:
from diffsky.data_loaders.opencosmo_utils import compute_phot_from_diffsky_mock
catalog = compute_phot_from_diffsky_mock(catalog, aux_data, bands = ["lsst_u", "lsst_i"], insert = True)
photometry = catalog.select(("lsst_u", "lsst_i", "lsst_u_new", "lsst_i_new")).get_data("numpy")
assert np.allclose(photometry['lsst_u'], photometry['lsst_u_new'], atol=0.01)
assert np.allclose(photometry['lsst_i'], photometry['lsst_i_new'], atol=0.01)
Recompute photometry of disk/bulge/knot decomposition
The photometry of each morphological component can be calculated using the compute_dbk_phot_from_diffsky_mock function.
[8]:
from diffsky.data_loaders.opencosmo_utils import compute_dbk_phot_from_diffsky_mock
catalog = compute_dbk_phot_from_diffsky_mock(catalog, aux_data, bands = ["lsst_u", "lsst_i"], insert = True)
photometry = catalog.select(("lsst_u_bulge", "lsst_i_bulge", "lsst_u_bulge_new", "lsst_i_bulge_new")).get_data("numpy")

assert np.allclose(photometry['lsst_u_bulge'], photometry['lsst_u_bulge_new'], atol=0.01)
assert np.allclose(photometry['lsst_i_bulge'], photometry['lsst_i_bulge_new'], atol=0.01)
Computing photometry in other bands
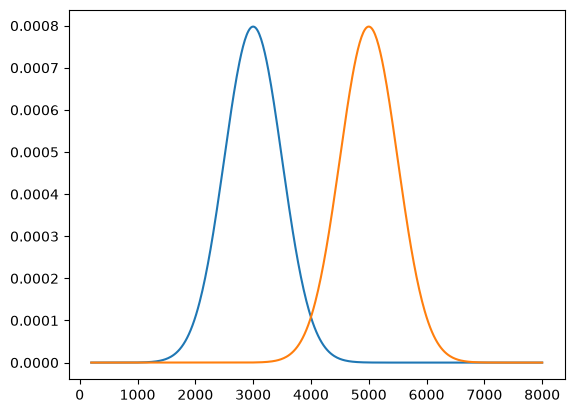
You can compute photometry in any band you like by simply providing new transmission curves
The next few cells show how to compute photometry through two fake bandpasses. We provide convenience functions for adding new transmission curves into the auxilliary data. This function expects tuples of (wavelength, tranmission_curve).
If you are interested in writing your updated data out in opencosmo format so you can come back to it later, you can do so with:
import opencosmo as oc
oc.write("path/to/output.hdf5", catalog)
[9]:
from jax.scipy.stats import norm as jnorm
from collections import namedtuple
from diffsky.data_loaders.opencosmo_utils import add_transmission_curves

wave = np.linspace(200, 8_000, 500)
fake_band_1 = jnorm.pdf(wave, loc=3_000.0, scale=500.0)
fake_band_2 = jnorm.pdf(wave, loc=5_000.0, scale=500.0)

# transmission curves will take their argument name
aux_data = add_transmission_curves(aux_data, fake_band_1 = (wave, fake_band_1), fake_band_2 = (wave, fake_band_2))

fig, ax = plt.subplots(1, 1)
__=ax.plot(wave, fake_band_1)
__=ax.plot(wave, fake_band_2)

# You should now see the new tranmission curves in the list of tranmission curves
print(aux_data["tcurves"]._fields)
('lsst_u', 'lsst_g', 'lsst_r', 'lsst_i', 'lsst_z', 'lsst_y', 'roman_F062', 'roman_F087', 'roman_F106', 'roman_F129', 'roman_F158', 'roman_F184', 'roman_F146', 'roman_F213', 'roman_Prism', 'roman_Grism_1stOrder', 'roman_Grism_0thOrder', 'fake_band_1', 'fake_band_2')
[10]:
from diffsky.data_loaders.opencosmo_utils import compute_dbk_phot_from_diffsky_mock
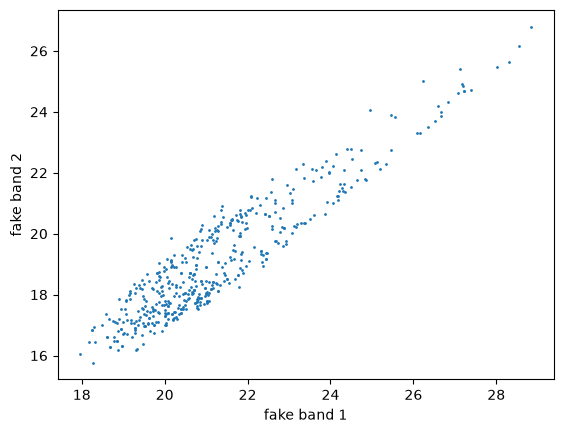
catalog = compute_phot_from_diffsky_mock(catalog, aux_data, bands = ["fake_band_1", "fake_band_2"], insert = True)
fake_magnitudes = catalog.select(("fake_band_1", "fake_band_2")).get_data("numpy")

fig, ax = plt.subplots(1, 1)

__=ax.scatter(fake_magnitudes["fake_band_1"], fake_magnitudes["fake_band_2"], s=1)
xlabel = ax.set_xlabel("fake band 1")
ylabel = ax.set_ylabel("fake band 2")
Compute SED of diffsky galaxies
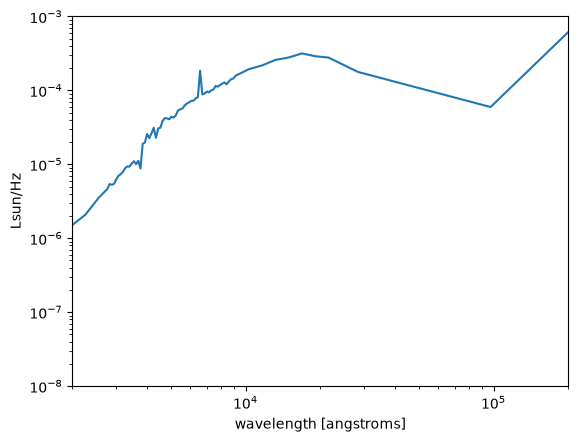
Diffsky can produce high-resolution SED of each galaxy. Be aware this computation is memory-intensive, and it is recommended you only compute it for typically no more than ~1000 galaxies at a time (the optimal choice depends on the amount of memory available on the machine you are using). You can control this by passing the batch_size argument. Because of the merging model (see note above), this argument actually controls the number of systems that are computed at once, rather than the exact
number of objects. The photometry functions used above also support the batch_size argument. You can turn off batching by passing batch_size = -1. If you do not pass a batch size, opencosmo will use a fairly conservative default.
OpenCosmo can handle multi-dimension columns (such as an SED). However for this example we will set insert = False which just directly returns the SED to us instead of inserting it into the catalog.
[11]:
from diffsky.data_loaders.opencosmo_utils import compute_seds_from_diffsky_mock
sed_catalog = catalog.take(50)
seds = compute_seds_from_diffsky_mock(sed_catalog, aux_data, insert=False, batch_size=25)
[12]:
fig, ax = plt.subplots(1, 1)
__=ax.loglog()
xlim = ax.set_xlim(2_000, 200_000)
ylim = ax.set_ylim(1e-8, 1e-3)

igal = 5
__=ax.plot(aux_data['ssp_data'].ssp_wave, seds["rest_sed"][igal, :])
xlabel = ax.set_xlabel('wavelength [angstroms]')
ylabel = ax.set_ylabel('Lsun/Hz')
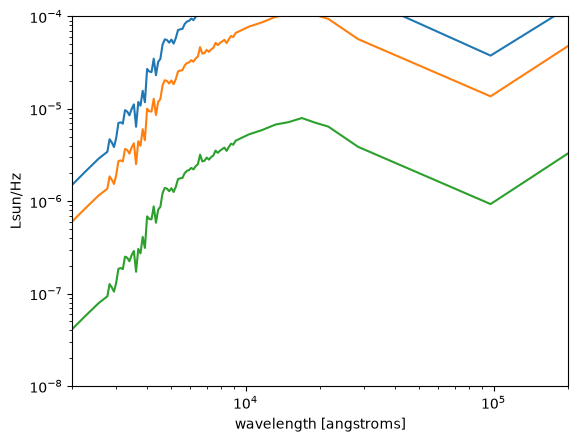
Compute SED of disk/bulge/knot components
As with photomtery, we can compute the SEDs for each of a galaxy’s individual morphological components.
[13]:
from diffsky.data_loaders.opencosmo_utils import compute_dbk_seds_from_diffsky_mock
dbk_sed_info = compute_dbk_seds_from_diffsky_mock(sed_catalog, aux_data, insert=False)
[14]:
fig, ax = plt.subplots(1, 1)
__=ax.loglog()
xlim = ax.set_xlim(2_000, 200_000)
ylim = ax.set_ylim(1e-8, 1e-4)

igal = 50
__=ax.plot(aux_data['ssp_data'].ssp_wave, dbk_sed_info['rest_sed_bulge'][igal, :])
__=ax.plot(aux_data['ssp_data'].ssp_wave, dbk_sed_info['rest_sed_disk'][igal, :])
__=ax.plot(aux_data['ssp_data'].ssp_wave, dbk_sed_info['rest_sed_knots'][igal, :])
xlabel = ax.set_xlabel('wavelength [angstroms]')
ylabel = ax.set_ylabel('Lsun/Hz')
[ ]: